
Import Congestion FAQ

Questions from importers…
Is there an end predicted for shipment delays and congestion?
Industry pundits do not have an end date for the current situation that’s affecting U.S. east and west coast ports, along with ports around the world. This is not a U.S. supply chain and shipping issue. It is global.
In June 2022, U.S. retailers projected near-record import volumes for this summer and into fall, warning that already-stressed ports and inland supply chains should prepare for continued challenges through the peak shipping season. Inland shipments from ports is a stress point.
The situation with imports from Europe is no different. U.S. imports from North Europe and the Mediterranean rose 8.9% year over year to an all-time high of 343,651 TEU in June following a 5.7 percent month-over-month increase in May, according to PIERS, a sister product of JOC.com within S&P Global.
What are current shipment import trends?
LA/Long Beach ports: West coast labor negotiations started in May. So far, workers’ commitment to keep cargo flowing during the talks has been honored. Automation appears to be the topic in question. The ship backlog in Southern California is decreasing, but marine terminal officials tell JOC.com they expect the backlog to build again as ships delayed in Southern China due to COVID-19 restrictions join the queue off Los Angeles and Long Beach.
China: China’s zero-COVID policy continues to make headlines. Regardless, ports remain operational.
East coast ports: PIERS data is now supporting the theory that shippers shifted imports to East Coast ports due to continued West Coast port congestion.
- The East Coast’s share of U.S. imports from Asia in July was 34%, up from 30.5% in July 2021
- The Gulf Coast’s share rose to 7.2% from 6.3%.
- Imports were up 18.7% in New York-New Jersey, 17% in Savannah, and 21.6% in Houston.
- The West Coast’s share dropped to 58.6% from 63.4% year over year.
European ports: North Europe is also contending with congestion at hub ports in the region, with full container yards and labor shortages hampering operations across terminals, warehouses, and trucking services, resulting in lengthening ship delays.
Rail dwell times: The majority of the cargo coming into the ports was inventory pull-forward (patio furniture coming from Asia in September that wasn’t needed until spring). The rails are struggling to keep up, particularly on the West Coast (despite a hiring frenzy), and both equipment and labor continue to challenge the network. This bottleneck in particular is causing delays and challenges.
We keep hearing about disruptions related to shipments. What’s the latest?
Labor is a continuous challenge in the current economic and health climate, as noted above in relation to April’s COVID-19 outbreaks in Asian provinces. We are keeping a close eye on West Coast labor negotiations.
Other disruptions include:
- Weather. This always plays a role in disruption. Typhoons in Asia are the most recent example.
- Truckers. The demand for trucks, truckers and chassis was a challenge prior to the pandemic. The shortage has been exacerbated with port congestion and demand for trucks.
- Warehouse. Space is in high demand as shipments arrive and await transport inland.
- Empty containers. Empties sitting on docks instead of moving back into the supply chain also remain an issue that’s disrupting supply chains.
- Conflict in Europe. Companies pulling out of Russia will impact all shipping space/allocations, from containers and tankers to dry bulk and gas transport.
Will shipping costs come down in 2022?
Freightos issues a weekly update. The Sept. 1 report shows:
- Asia-US West Coast prices (FBX01 Daily) were stable at $5,405/FEU. This rate is 71% lower than the same time last year.
- Asia-US East Coast prices (FBX03 Daily) were also unchanged at $9,073/FEU, and are 55% lower than rates for this week last year.
What is being done to help the situation?
The Ocean Shipping Reform Act (OSRA) was signed into law in June 2022. This is the first major reform to the U.S. Shipping Act since 1998. The bill revises requirements governing ocean shipping by increasing the authority of the Federal Maritime Commission, and shifts the onus of proving storage fees meet shipping law from the shipper to the container lines.
Meanwhile, as mentioned above, many shippers are choosing to route cargo through the Panama Canal with southeast and east coast destinations. As a result, several infrastructure improvement projects are being funded.
Truckers also are looking for new ideas to solve a long-term problem. We are seeing articles and hearing ideas from various partners about their plans to manage the congestion. Our trucker friends are looking to create trucker owned chassis pools instead of using the traditional leased chassis pool.
What are my options for planning shipments in the supply chain?
Plan ahead…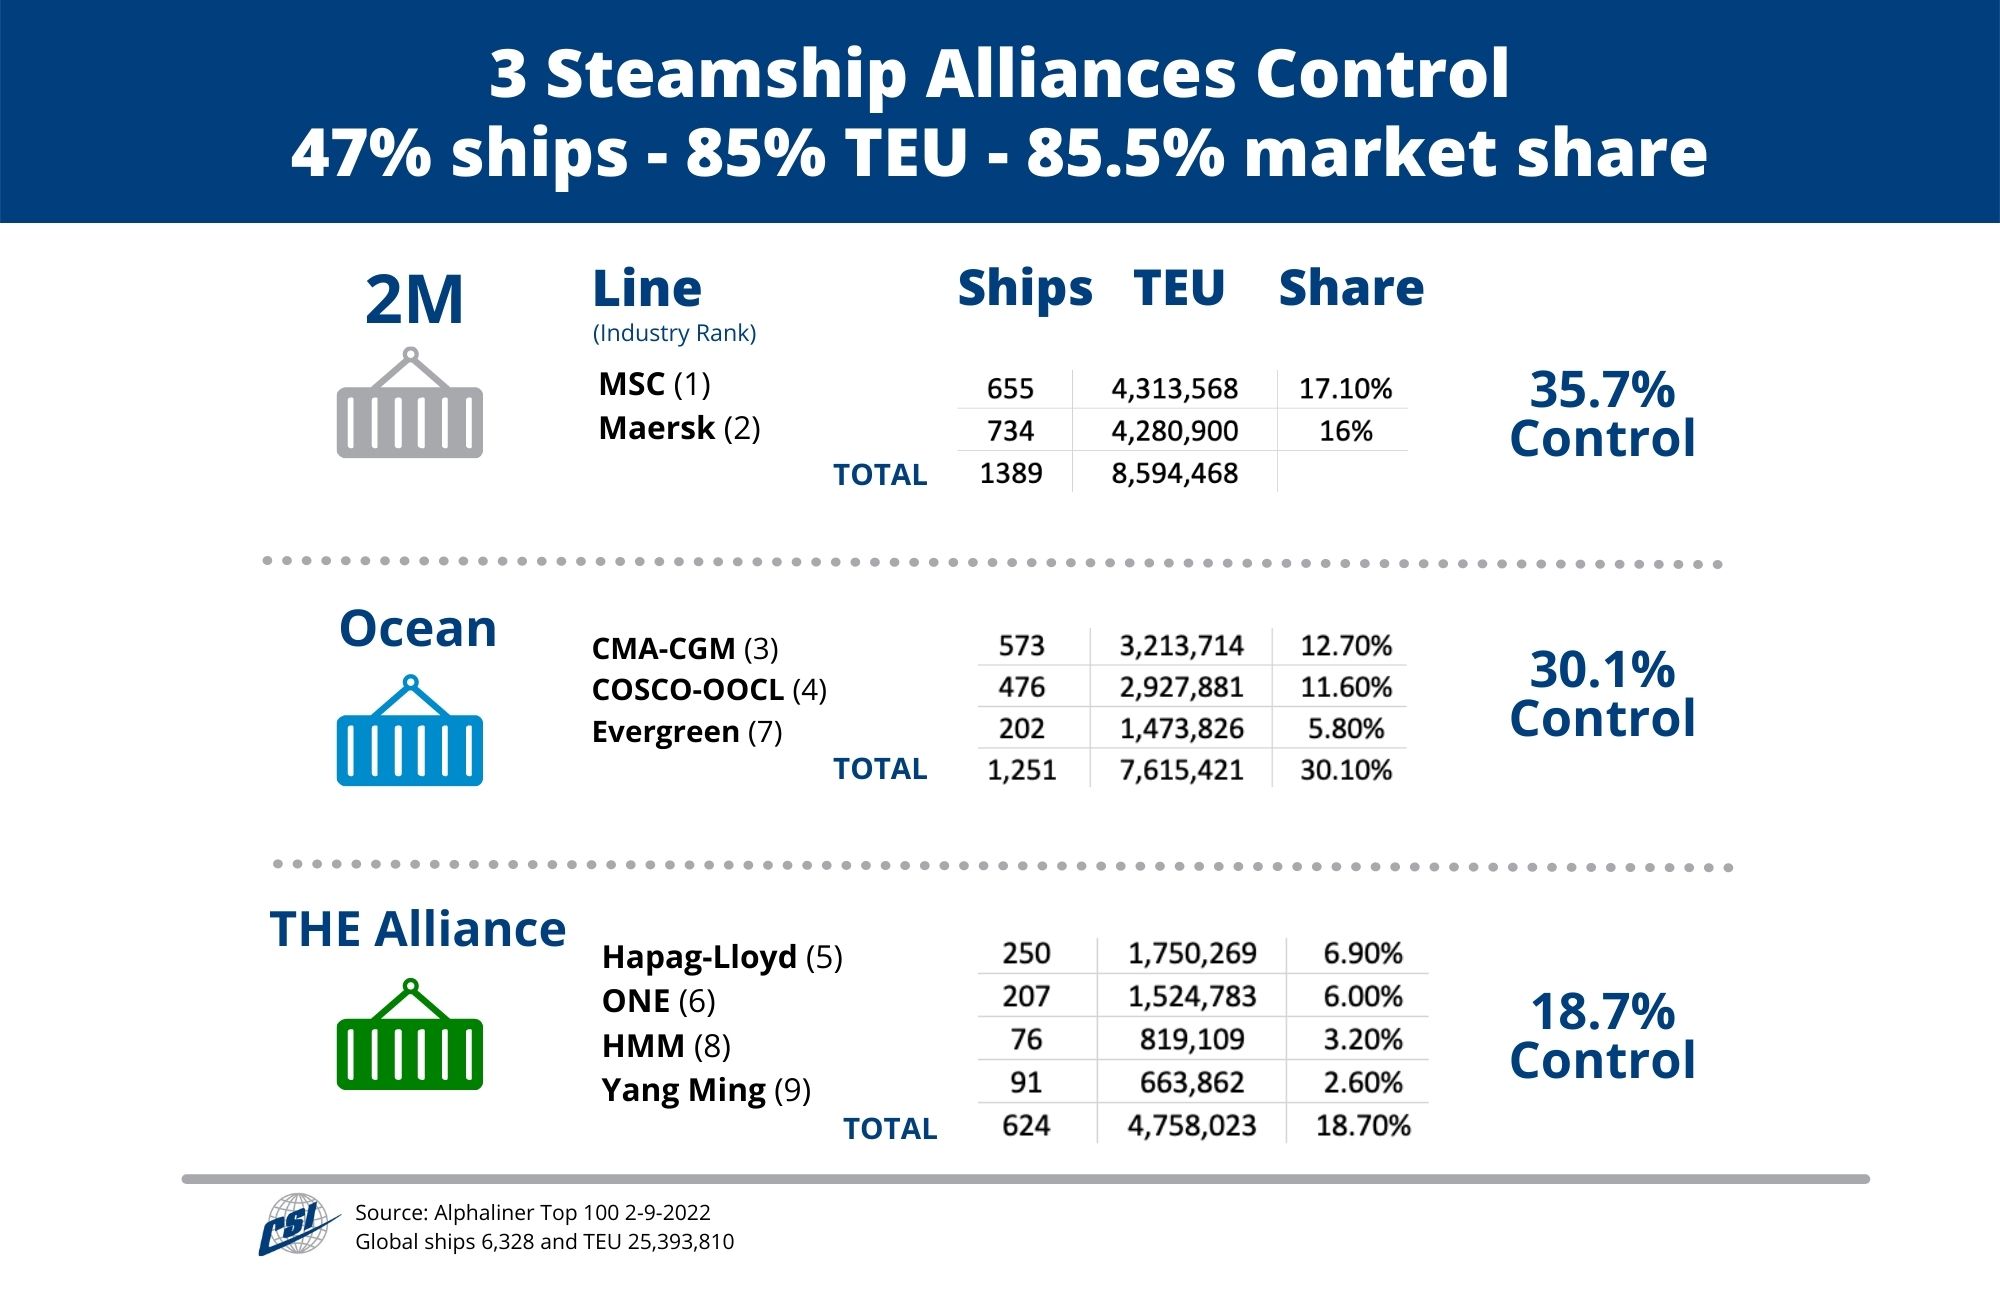
- Consider future orders. Understand and know how the three steamship line Alliances work and their options. Diversify shipments within these Alliances. If one shipment experiences a delay, it’s likely a shipment on another carrier in a different Alliance will continue through transit. Use this infographic for information on Alliances.
- Know the different port options available. LA/Long Beach is the most congested. Could a shipment move through the Panama Canal to the East Coast more efficiently?
- Consider trucking from a different ramp. Midwest options: Louisville, Cincinnati, Chicago, Cleveland, Columbus, Detroit, St Louis.
- Space is king. If you’re offered space, book it regardless of price.
- Check out this article on our blog that outlines the current situation and recommendations.
Is air freight still an option to mix into the supply chain?
Perhaps, depending on supply chain requirements and budget. The global air cargo market performance data for August offers a glimmer of hope for volumes in the upcoming peak season as the decline in demand seen over the previous four months slowed and general air cargo rates between Europe and North America stabilized, according to the latest weekly analysis from CLIVE Data Services, part of Xeneta.
After -8% and -9% year-on-year falls in demand in June and July 2022, August volumes were a more modest -5% adrift of the August 2021 level, and -4% compared to the pre-pandemic 2019.
If you have questions that are not asked and answered here,
contact your Cargo Services representative or our office directly.